Data is a hot topic. Businesses want to gather it, learn from it, and use it to drive efficiency across every aspect of operations.
Marketing and sales teams know this all too well. The days of generalized, untargeted broadcasting are long gone.
To drive customer messaging that converts, you have to acknowledge the importance of customer journeys that are both personal and relevant.
You have to embrace the data-driven transformation.
Beyond drinking the pro-data Kool-Aid, however, you need to put the right tools and processes in place for translating data into tangible results. Here’s how — with help from Leadfeeder.
Note: Ready to dive deeper on the quality of your website traffic? Start your free 14-day trial and discover new leads today.
Without data, you’re just guessing
It’s hard to lead or manage anything when you have nothing to measure. To move a project, campaign, or personnel forward, you have to be able to pinpoint progress.
Without any data, you’re taking a stab in the dark and hoping for the best.
This is natural when starting something new. For example, if your team is new to account-based marketing, there are going to be plenty of things you haven’t learned yet.
As time goes on, however, you should be able to inform and evolve your efforts with tracked metrics — also known as key performance indicators (KPIs).
What are good KPIs to measure?
KPIs can be defined as measurable values that demonstrate how you’re achieving set business goals.
These values can vary on a case by case basis. They may shift by channel, campaign, and end-goal.
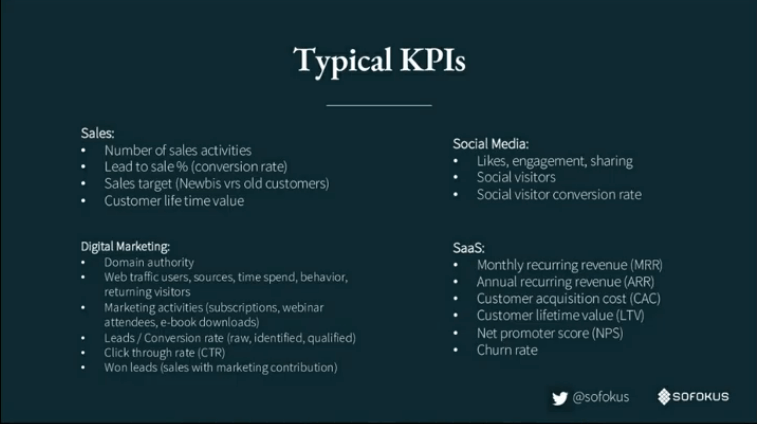
More often than not, there are a consistent handful of lead generation KPIs marketers should use to stay on track.
These KPIs include:
Qualified lead volume
Lead quality
Lead conversion rate
Customer acquisition cost (CAC)
Lead value
At the end of the day, it’s not about tracking and using all of the data. You want to pay attention to what’s critical for your business.
Good KPIs reveal the challenges and problems in your processes or organization. They track development (or a lack thereof). They show the full picture — the activities, the doing, and the results.
Realizing value in KPIs is all about visualization. Creating dashboards for everyone to access and compare to weekly encourages thoughtful reaction.
Inconsistent tracking paired with a pulled fire alarm every time your metrics are in the red isn’t a pleasant or efficient way for any team to operate.
Use this KPI Canvas template from Sofukus to define your team’s key metrics.
Using Leadfeeder to visualize inbound marketing lead data
With so much data at your fingertips, the real challenge arises in analysis. How do you make sense of KPIs in a way that helps you reach your goals?
Data visualization is the answer.
Google Analytics (GA) can be a great tool for adding context to metrics — if you know how to configure the dashboard, create reports, and can translate their glossary of terms.
In terms of visualization, however, Google Data Studio brings your data to life.

Pulling information from GA, you can easily create dashboards and distribute them for analysis among stakeholders.
These dashboards can be as broadly focused or in-depth as you need them to be. From keyboard tables to time series, bar charts to heat maps, there are plenty of ways to animate your key business metrics.
Better yet, with our Google Data Studio Connector, you can easily sync website visitor data from Leadfeeder into your GA dashboards.


For example, say you’re tracking leads generated from a webinar. You can create dashboards that identify both the number of identified leads and the lead quality.
Measure this against the number of times they visited your website, the pages they visited, the industries they represent, and more. Having this information available to your marketing and sales teams better equips both sides to follow up on the right leads.
How to turn lead data into conversions
With high-value leads identified and qualified, how do you connect? How do you take action in a way that effectively turns your leads into conversions?

For starters, alignment between your sales and marketing teams is key. Keeping everyone in a silo means your data will be tracked in silos as well.
When these teams sit in separate rooms speaking different jargon, the level of understanding between them is hindered.
Rather than operating with marketing- and sales-specific funnels, build it as one continuum.
Sit everyone in the same room, hold weekly joint meetings, and work under centrally defined and agreed-upon terms.
Marketing should be accountable for the quality of leads they provide, just as sales should be accountable for their follow-up on them.
Alignment applies to customer support as well. All of your teams should communicate with each other regularly for the sake of creating a customer experience that converts.
Optimizing for conversion starts with building a culture of respect and transparency. Wins and losses should be celebrated collectively.
Additionally, the digital tools you implement will serve as glue to hold sales and marketing together.
A tool like Leadfeeder, for example, makes it easy for sales teams to gain insight on leads early in the funnel.
It’s much easier to cater your prospecting outreach to a potential customer when you know something about them.
Final thoughts: converting your website data into business intelligence
Converting website data into business intelligence really hinges on your company’s ability to do three things: identify, qualify, and connect.
It’s a process that requires you to be patient with what you don’t know, transparent with what you do, and communicative throughout.
Partner with the right tools and include the right stakeholders at every stage to ensure the data you are collecting is put to good use.
Note: Ready to dive deeper on the quality of your website traffic? Start your free 14-day trial and discover new leads today.
Get more from your web analytics.
t’s time to turn your website traffic data into something more meaningful. Website visitor analytics enable you to identify and qualify the companies visiting your website, even when they don’t fill out a form.
Show me how

