60-Second Summary
Google Analytics can feel overwhelming with jargon like bounce rate and average session duration, but it remains essential for understanding website traffic. This glossary decodes core terms and offers practical ways to measure, interpret, and improve site performance.
Key takeaways: GA organizes data by Account → Property → View and separates Dimensions (attributes) from Metrics (measurements). Focus on Sessions, Users, Bounce/Bounce Rate, Conversions, and Source/Medium channels to read traffic effectively.
Standout strategies & tactics: Use Events and Goals to capture meaningful interactions, manage tags via Google Tag Manager, tag campaigns with UTMs to reduce mysterious Direct traffic, and run A/B tests with Google Optimize; consider tools like Leadfeeder to identify company visitors.
Real-world lessons & frameworks: Context matters—single-page bounces can still be successful. Use Segments, Cohort Analysis, User Flow, and Site Speed to diagnose behavior. Maintain separate Views (master, production, testing) and iterate based on data.
Actionable framework: Audit tracking and UTM usage, define macro and micro conversions, implement events via GTM, validate in reports, then test changes with Optimize and repeat.
*This summary was created with AI assistance, using our original content.
It’s like explaining scarves to someone for the first time. Why isn’t a scarf called a face and neck covering? And, what’s a snood? Confusing, but I don’t make the rules.
Anyway…maybe I’m exaggerating here, but if you’re new to Google Analytics (or scarves), you can get this feeling of being choked by a Brillo pad, especially with vague words like “bounce rate” and “average session duration.”
And yet, Google Analytics is a tool worth mastering in the marketing world — technicalities and all — for the sake of understanding your website traffic.
So, you’d better equip yourself with some basic understanding of key terms. Here, let me help. I’ve created this Google Analytics Glossary. Study it, bookmark it, and impress all of your nerdy marketing friends with how well-versed you are in the ways of website analytics.
Off we go…
Note: Want to see which companies visit your site? Try Leadfeeder free for 14 days.
Google Analytics Glossary
Account
Yep, we’re starting things off easy. Your Google Analytics account is where everything lives. This is the top-level folder you arrive at upon logging in.
Leadfeeder identifies companies visiting your website using its own Tracker script and proprietary databases. You can optionally connect the GA Connector to send firmographic data into GA4.
A Google user (e.g., user@gmail.com) can have multiple Google Analytics accounts, but in most cases a single account is sufficient.
However, if you’re managing different websites that aren’t related (i.e., websites that don’t share the same domain), their analytics will be stored in different accounts.
If you’re handling multiple accounts (e.g., your personal blog and a client’s company website), you can share access to either account with multiple users.
Pretty standard stuff, thus far. Let’s keep it going.
Acquisition
The Acquisition report gives you insight into how people are finding your website. Data in this report is built around the Source and Medium of a user’s journey.
You can expand on these acquisition dimensions by segmenting reports by paid traffic from Google Ads, organic Google traffic, social traffic, and custom campaign tags.
You can also see this in our Leadfeeder app. Snazzy, huh?
Assisted Conversion
The Assisted Conversion report, found under Multi-Channel Funnels, guides you through which marketing channels helped in making a conversion.
For example, if a user came to your site from Facebook, exited, and then later returned from Google Ads, Facebook will be counted as an assisted conversion.
This report also helps identify other assisted conversions based on dimensions like Source, Medium, Campaign, landing pages, and more.
Audience
An Audience is a custom set of users you choose to group together based on attributes found meaningful to your business.
Once an audience has been defined, you can activate it on platforms like Google Ads Display and Video 360 to better focus your marketing efforts.
You can also apply audiences to your Google Analytics reporting to further analyze and explore behavior. They can be used as secondary dimensions or as a dimension in segments, custom reports, and custom funnels.
Average Session Duration
The Average Session Duration provides a top-level view of how long users spend on your site. It is calculated by dividing the total time spent on the site by the total number of users.
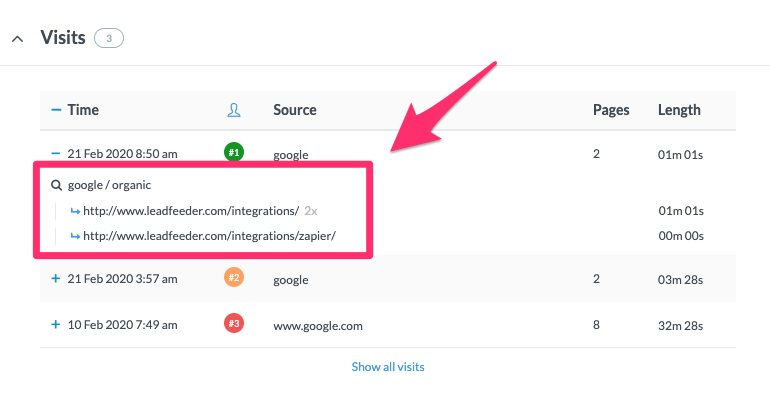
This is also displayed in Leadfeeder. Check it out below.
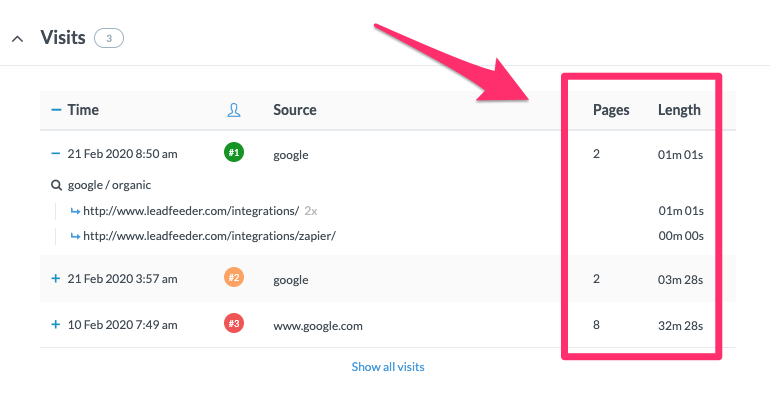
In the image above, I see this person found us organically on Google from our Integration page, and they spent about 0:01:01, an average of 1 minute and 1 second on our site before closing the browser or navigating elsewhere.
Google Analytics does not count the time spent on the last page viewed during a session, which means the average session duration tends to be lower than the actual time people spend on your site.
Bounce
Bounce is defined as Sessions that only have one Interaction. In other words, it’s a visitor who only sees one page before leaving your site.
Bounces are sometimes associated with uninterested prospects, but this isn’t always the case.
For example, if a visitor types “Leadfeeder pricing” into Google, ends up on our pricing page, finds the information they need, and leaves, it’s a bounce that still counts as a potential lead.
You can decrease the number of Bounces by adding Events that cause Interactions.
Bounce Rate
Bounce Rate is the percentage of visitors who have bounced from your site.
For example, if you have 10 visitors to your website and 5 leave without visiting more than one page, your bounce rate would be 50%.
Your bounce rate can provide top-level insights into how your content performs.
Just remember to take context into account when analyzing bounce rate, because some pages may deliver all the information a visitor needs on a single page.
Calculated Metric
Calculated metrics let you create your own metrics in addition to the default metrics in your report.
For instance, you can track an average cost per session. This calculated metric can be useful when there are multiple sessions per user and the cost-per-click (CPC) isn’t accurate.
This particular value is calculated by dividing the average cost by the number of Sessions.
Campaign
A Campaign tracks the specific ways users discover your website or app.
Channel
A Channel groups sources of traffic together. It combines the Source and Medium dimensions to better understand overall performance.
For example, all referral traffic coming from all kinds of pages is grouped under Channel Referral, and all social traffic is grouped under Social.
You can edit your channel groupings in your Google Analytics View settings.
Client ID
A Client ID represents a device or cookie. It consists of a random number and a timestamp — and can be used to recognize returning users.
You can locate client IDs in the Audience - User Explorer report.
One thing to note is that when a user switches devices or browsers on a return visit to your site, a new client ID is created, and the returning user is counted as a new user.
Client ID cannot be used to measure across all devices.
Cohort Analysis
The Cohort Analysis report shows you users segmented by date. This provides insight into when users are acquired and when they return to your site.
Conversion
A Conversion represents the number of times users complete your defined goals. Each goal reports a maximum of one conversion per session, while every transaction is reported.
Conversions are set up in Google Analytics alongside goals — divided into macro and micro conversions.
Macro conversions are actual business goals (e.g., a purchase or sign-up). Micro conversions are actions that lead to conversions (e.g., adding a product to the cart or subscribing to an email list).
Note that Google Ads and Analytics calculate conversions differently.
Dimension
Google Analytics collects two types of data: Metrics and Dimensions.
Dimensions are attributes (or characteristics) of your users and their interactions with your site, such as Page, Source, or Country.
The dimension is displayed in the first column of the standard Google Analytics report. You can build custom dimensions for your own data, but typically, they’re defined at the Hit, Session, User, or product level.
Direct Traffic
Direct Traffic refers to traffic that doesn’t have another source. It’s commonly misunderstood as traffic that comes directly from typing the URL into the address bar.
Direct traffic sessions may include cases where Google Analytics can’t identify the source of the click.
Nowadays, most direct traffic comes from mobile apps (e.g., Facebook, Twitter, and email) and non-tagged links from SSL-site referrals, if you are not using SSL.
Direct traffic likely accounts for a large share of your overall traffic, so you should try to reduce it as much as possible by tagging your links with UTM parameters and using SSL.
Ecommerce
E-commerce is a set of reports for online shops. Using E-commerce reports requires enabling E-commerce Tracking.
Engagement
Engagement measures how much time a group of visitors spends on a site or the Page Depth surrounding a group of visitors.
The Engagement Report segments your visitors into groups based on their engagement. You can’t apply secondary dimensions or review Goals and E-commerce conversions in this report.
Entrance
An Entrance is the first page of the Session. Think of it as the number of times the page has served as the Landing Page.
For example, if page X serves as a landing page six times, it’ll have six entrances, too.
It’s similar to the Sessions metric but can vary when multiple Hit types are sent to Google Analytics.
Events
An Event is a custom interaction (or attribute) on your site triggered by user behavior, though it may not always be initiated by the user.
Events are often used to track clicks on buttons and links, scrolling, and file downloads. Events can be set to either non-interaction or interaction events. The former does not affect the Bounce Rate while the latter does.
Events require some custom implementation to be tracked and reported in Behavior reports. It can also be used in configuring event-based Goals.
Exit
An Exit is the last page of a Session before a visitor closes the browser or leaves the page.
Frequency
Frequency is the number of times a page was visited by a user in a given time period. It’s calculated by dividing the number of Sessions by the number of Users.
Goals
Goals measure specific objectives you’ve deemed valuable to your business. Think of them as Google Analytics’ way of defining Conversions on your page.
A goal can be defined as users visiting a specific page, subscribing to an email newsletter, or achieving a certain number of Pageviews or Visit Duration.
If a goal is completed multiple times during a single session, it will be counted as a single conversion.
Google Optimize
Google Optimize is Google’s platform for A/B and multivariate testing and personalization. It allows you to present different variations of content on your website to improve conversion rates.
It’s free to use, and you can have three tests running with it at any time. There’s also a paid version available called Optimize 360, with fewer limitations.
Google Tag Manager
Google Tag Manager is a tool that helps you manage your different marketing snippets and other tags on your website.
It lets you test tags on your site before deployment, reducing your reliance on IT to manage tracking tags.
Because it integrates well with Analytics, it can help you improve the quality of your data by collecting more data.
Sign up for a free 14-day trial with Leadfeeder. Simply add the Leadfeeder Tracker to your Google Tag Manager to watch the data pour in.
Hit
A hit is a request sent to Google Analytics with the Measurement Protocol for data collection and handling.
The most common type of hit is a Pageview, though hits sent to Google Analytics can involve other types of interactions, such as Events.
Impression
An Impression is the number of times an ad was visible on a user’s display. Think of impressions as the Pageview in the Google Ads world.
Landing Page
A Landing Page is the first page a User visits on a website — in other words, the Entrance page. It’s the URL of the first Pageview of a Session.
Medium
In acquisition reports, Medium indicates how the Acquisition was made. Different examples of media include email, social, CPC, referral, or none.
Metrics
Every report has Metrics and Dimensions.
Metrics are individual elements of a dimension that can be measured in sums or ratios. These are calculations and measurements run based on your data — such as Sessions, Conversions, or Time on Page.
Pages/Session and Average Session Duration are two examples of metrics. You can build custom metrics to measure something that’s not available directly in Google Analytics, too.
Organic Traffic
Organic Traffic is traffic originating from organic results on search engines such as Google, Yahoo, or Bing.
If this rings a bell, then you probably work in SEO. If it doesn’t, well, good thing you’re reading this. Timing, it’s everything.
Pages/Session
Pages/Session counts the average number of pages visited per session over a certain date range. This includes repeated views of a single page.
For example, if a website visitor views three pages on their first visit and only one page on their second, their Pages/Session is two. It is calculated by dividing Pageviews by Sessions.
Page Depth
Page Depth is understood as the number of pages visited during a Session.
Pageviews
Pageviews count the number of times a user has loaded any page on your website.
If the user refreshes the page, it will count as a new pageview. For example, if a user lands on the front page, refreshes, and then views another page, they will have three pageviews.
Property
A Property is a sub-component of an Analytics account that can be used to track a single website or mobile app. The property also determines which data is organized and stored together.
Query
A Query is a request for information that is retrieved from a database. After integrating Google Webmaster Tools, you can see the search queries visitors use to land on your website.
Recency
Recency is the average time between visits to a website by Users. It’s calculated by dividing the time between the first and last Sessions by the total number of sessions by user.
Referrals
Referrals are a type of Channel that groups all traffic originating from links on other pages that are not associated with some other type of traffic (e.g., Social, Paid Traffic, or Organic).
In other words, if you click on this link to Leadfeeder’s homepage, your traffic would be shown as Referral traffic on our site’s Google Analytics.
Referring Sites
Referring Sites are external websites sending traffic to your site. Referring sites usually have a backlink pointing to your site.
Reports
Google Analytics Reports show you what’s going on across your site for a given period of time.
They’re divided by Segments such as Real-time, Audience, Acquisition, Behavior, and Conversions. What appears in these reports is pre-determined by Google Analytics.
Google Analytics offers over 50 free reports and the ability to create custom reports for hyper-relevant, specific use cases in your business.
As I mentioned above, the Google Analytics Network Report changed in February 2020.
This changes everything. Well, no, not really. But it does change one thing. More of a tweak, really. But still…it allowed us to push our Leadfeeder Tracker script.
Segments
Segments are a subset of Sessions or Users that share common attributes. They let you slice your traffic into smaller segments based on a shared property.
For example, you can build a segment out of your mobile users, users who view more than 5 pages, or users from a particular source.
You can also combine filters as much as you like, allowing you to compare different groups of visitors.
Sessions
A Session is a group of interactions that happen on your site during a given date range. It shows the period of time a User was actively engaged on your site
A Session in Google Analytics begins when a visitor arrives on your site and ends when one of the following happens:
A user is inactive for 30 minutes
A user arrives on the site with another Campaign Source
At midnight
For example, if a user lands on your front page, reads a few pages, and then opens a new tab, clicks on one of your ads, and lands on another page of your website, this visit will be counted as two sessions.
Likewise, if a user lands on your page at 23:59 and reads a few pages before leaving at 00:08, it will be counted as two sessions, too.
Alternatively, if a user lands on your website, reads a few pages, and then opens a new tab, types your website URL into the address bar, and lands on another page of your website, it’s still counted as one session.
It’s important to note that sessions are different from Clicks in Google Ads, LinkedIn Ads, or Facebook Ads. The amount of Sessions accumulated from a certain campaign is almost guaranteed to be lower than the reported amount of clicks in the same campaign.
For example, if someone clicks on your ad but closes the browser before the Analytics script has time to load, a click but not a Session will be recorded.
Site Speed
The Site Speed report tells you how quickly your website loads on average.
Site speed has SEO implications, and even Facebook gives preference to quick-to-load pages in the Newsfeed. Spend time optimizing your website to make sure it loads as quickly as possible, especially on mobile.
Social
Social appears as a marketing channel in the Acquisition report, which includes traffic from social media sites, such as Facebook and Twitter.
Source
A Source (or Traffic Source) is a dimension that tells you the origin of a visit.
It’s one of the four main dimensions — with Medium, Channel, and Campaign — for reporting and analyzing how people find your site.
Sources are grouped into channels that commonly include:
Organic search results, or traffic directly obtained from Google search results
Paid traffic (e.g., traffic from Facebook or CPC ads)
Direct traffic (e.g., users entering a URL directly into their browser or entering a site using a bookmarked link)
Referral traffic (i.e., traffic from another site)
Time on Page
Google Analytics measures Time on Page by starting a timer when the page loads and stopping it on the next interaction. Because the last page doesn’t have a “next interaction,” time on page is always zero seconds for the Exit page.
Transaction
A Transaction is a purchase on your website that is reported in Google Analytics.
Each transaction is associated with a transaction ID sent to GA from your e-commerce system using a tracking code.
Users
Users are unique website visitors or app users who have initiated at least one Session on your website or app during a specific date range.
Users and Visitors are used interchangeably, but in the context of the New vs Returning report, they’re distinct. In this case, New Visitor is a Dimension, whereas New User is a Metric.
Users are one of the hardest metrics to grasp because they don’t actually represent users; they represent cookies or devices. It groups together sessions made with the same device.
A user is represented in Google Analytics by a client ID and is set by the ga cookie.
Types of users include:
New Users
The first time a device or browser loads your website, GA creates the client ID and sends it to the GA server. This unique ID is counted as a new user
Returning Users
If GA detects an existing client ID in a new session, it counts the session as a returning user.
Active User
GA also uses a metric called active users, which refers to real-time users (people on your site right now). This is most often used in the context of real-time reports (e.g., the Active Users report). Active users can be tracked with 1-day, 7-day, 14-day, or 30-day time restraints.
Note that the total number of users reported by Google Analytics is not equal to the sum of new and returning users, because the platform counts new users as returning if they return within the selected time period, creating an overlap.
User Flow
User Flow is a visualization of the pages a user visited on your website during a single Session, showing the pages they visited from the source page through to the Exit page.
Views
In each of your Google Analytics properties, you can have one or more views containing data from your website. Views can contain either the complete set of data from the tracking code or a subset filtered by using filters.
The best practice is to have at least three views for each of your Properties: master, production, and testing. Goals and some other configurations are defined on the View level.
Visit Duration
Visit Duration is the amount of time a visit lasts. It’s calculated by adding together Time on Page for all of the pages a user visited during their Session.
Visitor
Visitors in Google Analytics are almost identical to Users. However, a Visitor is a Dimension while a User is a Metric.
Visitors Flow
Visitors Flow is a report that shows how Users have interacted with your site in chronological order, from the landing page to the exit page.
Final thoughts
Look, I get it. Google Analytics can feel like you’re driving with your eyes closed. Sure, there is a mix of excitement and fear. Your heart is racing, and your armpits are sweaty.
Hopefully, this article allowed you to see the road a bit clearer. Worse-case scenario, you’re driving Google Analytics with your eyes closed and no hands (look ma!), but still gathering data.
So, you’ve already won. But, just to ensure that you get the most out of your ride with Google Analytics, think of this article like your Italian leather swathed in cashmere driving gloves. It’s simply here to help you steer.