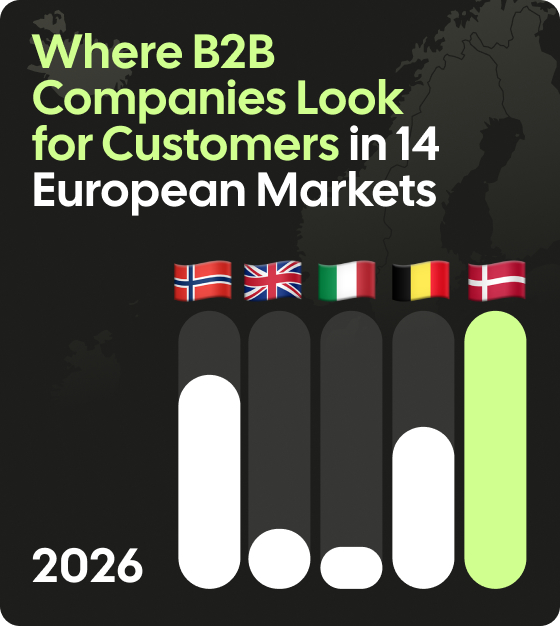
The map below shows all 14 markets ranked from most to least contested. The ranking uses foreign sellers per million local enterprises: the number of foreign companies targeting a market, compared with the number of businesses in it.
Best for sellers who can stand out in the most crowded market in the study.
Top metrics:
Foreign sellers per million enterprises: 2,140, rank 1
Foreign companies targeting Denmark: 820
Rank as a foreign market for Swedish companies: 3rd
Danish companies targeting Germany: 16.3% in 2023, 21.3% in 2025
Average countries targeted by Danish companies: 6.2
Denmark has the most foreign sellers per local business of the 14 markets, 115 more per million than Norway. It is a small, high-income economy, and in our Doing Business in Europe ranking it has the highest enterprise AI adoption rate in Europe, at 42.0%. Danish companies are also targeting Germany more: the share rose from 16.3% in 2023 to 21.3% in 2025.
Best for sellers who want a Nordic market with high productivity and a little less foreign competition than Denmark.
Top metrics:
Foreign sellers per million enterprises: 2,025, rank 2
Foreign companies targeting Norway: 909
Rank as a foreign market: 1st for Swedish companies, 2nd for Danish companies
Average countries targeted by Norwegian companies: 4.4
Norway sits just behind Denmark. It is the first foreign market for Swedish companies and the second for Danish companies. In our Doing Business in Europe ranking, Norway has the highest labour productivity of all 29 countries, at 123.0.
Best for Nordic sellers expanding within the region.
Top metrics:
Foreign sellers per million enterprises: 1,620, rank 3
Foreign companies targeting Finland: 735
Rank as a foreign market for Swedish companies: 2nd
Finnish companies targeting Germany: 12.5% in 2023, 18.6% in 2025
Average countries targeted by Finnish companies: 6.4
Finland completes the Nordic top three. Like Denmark and Norway, it is a small market with a high number of foreign sellers per local business. Finnish companies are also targeting Germany more, and the rise from 12.5% to 18.6% between 2023 and 2025 is larger than for Danish or British companies.
Best for sellers who want the EU’s second-largest economy with far fewer foreign competitors than the Nordic markets.
Top metrics:
Foreign sellers per million enterprises: 170, rank 13
Foreign companies targeting France: 900
Not a top three foreign market for any home country in our language data
Average countries targeted by French companies: 5.7
France is the EU’s second-largest economy, but it has less than a tenth of Denmark’s foreign sellers per local business. In total, more foreign companies target France (900) than Denmark (820). France has far more local businesses, so each one hears from fewer foreign sellers.
Best for sellers who can work in Italian and want a large market with little foreign competition.
Top metrics:
Foreign sellers per million enterprises: 140, rank 14
Foreign companies targeting Italy: 647
Not a top three foreign market for any home country in our language data
Italian companies targeting markets outside Italy: 41.7%, the lowest of any European home country
Average countries targeted by Italian companies: 5.1
Italy is a G7 economy, but it has the fewest foreign sellers per local business in the study. Italian companies also look abroad less than companies from any other European country in the study. A seller who can work in Italian faces less foreign competition there than in any other market we ranked.
Language, clearly. When B2B companies cross a border, they overwhelmingly follow a shared or familiar language rather than the shortest route to a large market.
The corridors are unmistakable. German-headquartered companies expand into Austria and Switzerland. Dutch companies move into Belgium. The Nordic countries interlock, targeting each other before anywhere else.
That corridor shows up in the attention ranking too. Switzerland and Austria are the fourth and fifth most contested markets of the fourteen, at 1,522 and 1,430 foreign sellers per million enterprises, ahead of Sweden and roughly four times Germany's own figure. Neither is a large economy. Both are the first place German-speaking sellers go, and 173 German companies target Austria alone, more than target the United Kingdom and the United States combined. Crowding follows language as closely as expansion does.
The pattern makes commercial sense. A shared language collapses the cost of localisation, sales conversations, and support. But it also means most companies are competing in the same familiar corridors while lower-competition markets (see the Italy and France spotlights above) stay comparatively open.
The smaller the home market, the wider the hunt. Portuguese-headquartered companies target 9.1 countries on average, the widest net in the study. US-headquartered companies, sitting on a vast domestic market, average 3.9.
The logic is straightforward: when your home market caps your growth, you internationalise early or you stop growing. Sellers in small, open economies build cross-border muscle as a survival trait.
The mirror image is just as telling. Italian companies are the most domestic sellers in the study, a finding that pairs neatly with Italy being Europe's most overlooked market. That is consistent with the official picture: only around 30.7% of EU SMEs export at all.
On a like-for-like basis, yes, but modestly. Holding the composition of our customer base fixed at 2023 weights, the US share of new B2B targeting falls from 43.5% to 40.8% between 2023 and 2025, while Germany's rises from 15.4% to 18.1%. European sellers are concentrating on Germany.
The unadjusted numbers look more dramatic: the US share of new targeting fell from 43.5% to 34.2% over the period, a fall of 9.3 points, while Germany's rose from 15.4% to a record 23.5%. We are publishing the adjusted figures as the headline because roughly two thirds of that raw swing reflects changes in the composition of our own customer base over the period, and about one third reflects a real shift in behaviour. The decomposition is in the methodology.
The strongest evidence for the German pull is what individual countries' sellers do. Between 2023 and 2025, the share of German-headquartered companies targeting their home market rose from 78% to 90%. The share of Finnish-headquartered companies targeting Germany went from 12% to 19%, Danish from 16% to 21%, and British from 9% to 12%.
One thing the data does not show: companies abandoning the US for Germany. Among the 358 companies active in our data in both 2023 and 2025, targeting simply spread across more markets, diluting the share of every large incumbent destination. The pattern is diversification, not switching.
That matches what European firms tell surveys. The EIB found 19% of European firms diversifying the countries they trade with, and only 7% reshoring entirely. And 48% of European firms cited concern about US tariffs in 2025. Surveys capture the stated intent; our data shows the same shift already happening inside pipeline decisions.
De-risking is not a policy abstraction; it shows up in targeting choices. The share of new B2B targeting pointed at Russia has fallen 76% since 2020. Targeting of China has halved since 2022.
Neither market collapsed to zero, which is its own finding: some sellers continue to pursue both. But the direction is unambiguous, and it mirrors the macro picture of global trade networks reordering as firms reduce their reliance on single large economies.
The study covers B2B companies that set country-targeting filters on the Leadfeeder platform between 2017 and 2026: 95,243 targeting decisions made by 9,290 distinct companies. Findings are reported for European destination markets where minimum cell sizes are met; trend findings compare 2023 with 2025.
Fourteen European destination markets meet those thresholds and are ranked: Austria, Belgium, Denmark, Finland, France, Germany, Italy, the Netherlands, Norway, Poland, Spain, Sweden, Switzerland and the United Kingdom. Other European markets appear in the underlying data but fall below the minimum cell size, so they are excluded from the ranking and from any claim about the most or least contested market. Seller home markets are counted separately from destination markets, which is why a country such as Portugal appears as an origin without appearing in the ranking.
When a company uses Leadfeeder, it can set country-targeting filters that define which markets it watches for buying signals. Each filter is a deliberate, operational decision about where that company is hunting for customers. This is revealed behaviour, not stated intent: no surveys, no self-reporting.
A targeting decision: one company choosing to include a country in its targeting. All findings count distinct companies, not filter volumes, so one very active company cannot skew a market's numbers.
Seller home market: a company's headquarters country. It is a proxy; a small share of companies target from subsidiaries.
Market attention: foreign sellers per million local enterprises in the destination country. This is the measure behind the map and the ranking table.
Share of new targeting: the share of a year's new targeting decisions pointed at a given destination. This is the measure behind the trend findings.
Leadfeeder's customer base skews Nordic and European, and its composition changed over the study window: US-headquartered companies fell from 26.2% to 17.9% of the companies configuring new targeting in our panel between 2023 and 2025, while German-headquartered companies grew from 5.5% to 10.9% and Europe-headquartered companies rose from 58.5% to 66.2%. All trend findings are therefore reported at fixed 2023 composition (holding each headquarters country's weight constant).
Of the raw 9.3 percentage-point fall in the US share, 6.6 points reflect this composition shift and 2.7 points reflect behaviour; of Germany's raw 8.1-point rise, 5.4 points are composition and 2.7 points are behaviour.
Two independent checks confirm the adjusted picture. First, we tracked the 358 companies active in both 2023 and 2025 as a fixed panel; within identical companies, targeting spread across more markets rather than rotating between destinations. Second, we re-ran the analysis with exclusion filters removed, counting only positive ("is") targeting; the results hold.
Enterprise counts per destination country come from official sources: Eurostat business demography (2023), the UK Department for Business and Trade Business Population Estimates (2025), and the Swiss Federal Statistical Office STATENT (2023).
Headquarters country is a proxy for home market. Small-base origin countries are excluded from standalone claims. Results describe the behaviour of companies on one platform; the composition adjustment and official denominators correct for sample skew, but this is a first-party signal that complements official trade statistics, not a census.
All figures reflect the data as at the launch-month refresh. Trend comparisons use 2023 versus 2025 full-year targeting decisions; the Russia trend is measured from 2020 and the China trend from 2022.
All figures are aggregated to country level and reported only where minimum cell-size thresholds are met, so that no individual company can be identified from the published data. The analysis was carried out by Leadfeeder as controller of its own platform-usage data. No personal data was processed. No customer website-visitor data that Leadfeeder processes on behalf of customers was used. All data is aggregated and anonymised. Results are reported at country level only, with minimum cell sizes enforced. No individual company is identifiable.
This study is free to cite, quote and reproduce with attribution. Journalists, analysts and researchers are welcome to use the tables and figures.
Suggested citation: Leadfeeder (2026), The Cross-Border Selling Map of Europe: Where B2B Companies Actually Hunt for Customers. Available at leadfeeder.com/resources/studies/cross-border-selling-map-of-europe/
Download the dataset: the full ranking for all fourteen markets, including foreign company counts, active enterprise counts and the per-million figures, is available as a Google Sheet.
For methodology queries or media enquiries, contact serban.giurgi@leadfeeder.com.
The map redraws a few assumptions. The biggest markets are not the emptiest ones: the Nordics are crowded, Italy and France are comparatively open, and the corridors most companies expand through are the same familiar language routes everyone else is using.
And underneath the headlines, the behavioural shift is real but measured: European sellers concentrating on Germany, spreading their bets across more markets, and quietly stepping back from Russia and China. Companies are voting with their pipeline before they say it in surveys.
Where a company points its targeting today is where its revenue plans to be in two years. That is what makes this map worth tracking.
Leadfeeder will refresh the cross-border selling map quarterly, tracking the mix-adjusted US-versus-Germany share as new data lands. Bookmark this page for the updated numbers. And if you want the same intent data at company level for your own site, that is what web visitor identification does: it shows you the companies already looking at you, wherever they are hunting from.
© 2026 Leadfeeder. All rights reserved.
For methodology queries or media enquiries, contact serban.giurgi@leadfeeder.com.
Frequently Asked Questions
Which countries do B2B companies target most?
By absolute volume, the US, Germany, and the UK receive the most B2B targeting. Adjusted for market size, the picture inverts: Denmark is the most contested market in Europe, with 2,140 foreign sellers per million local enterprises, followed by Norway (2,025) and Finland (1,620).
Are B2B companies leaving the US market?
No. B2B companies are diversifying rather than leaving. On a like-for-like basis the US share of new B2B targeting fell by about 3 percentage points between 2023 and 2025, and companies active in both years spread their targeting across more markets rather than dropping the US.
Why is Germany gaining ground with B2B sellers?
European sellers are concentrating on Germany. Between 2023 and 2025, the share of German companies targeting their home market rose from 78% to 90%, while Finnish, Danish, and British sellers all increased their targeting of Germany. On a like-for-like basis, Germany's share of new B2B targeting rose by about 3 percentage points.
Which European markets are most under-targeted by B2B sellers?
Italy is the most under-targeted market in Europe, with 140 foreign sellers per million local enterprises, followed by France at 170. For comparison, Denmark attracts 2,140. For sellers weighing a market expansion strategy, these are the markets where foreign competition for attention is thinnest.
Are B2B companies still targeting Russia and China?
Some are, but far fewer than before. The share of new B2B targeting pointed at Russia has fallen 76% since 2020, and targeting of China has halved since 2022. Neither market has collapsed to zero, but the de-risking trend in pipeline decisions is unambiguous.
How many countries does a B2B company target on average?
It depends on the size of the home market. Portuguese-headquartered companies target 9.1 countries on average, the widest net in the study, while US-headquartered companies average 3.9. Sellers from small, open economies internationalise earlier and more widely.
How is the most contested market calculated?
We count the distinct companies headquartered outside a market that target it, divide by the number of active enterprises in that market, and express the result per million enterprises. Enterprise counts come from Eurostat, the UK Department for Business and Trade, and the Swiss Federal Statistical Office. Counting distinct companies rather than filter volumes stops one very active company skewing a market.
Which European markets are not included in the ranking?
The ranking covers the fourteen European destination markets that meet our minimum cell sizes: Austria, Belgium, Denmark, Finland, France, Germany, Italy, the Netherlands, Norway, Poland, Spain, Sweden, Switzerland and the United Kingdom. Other European markets appear in the underlying data but fall below those thresholds. Seller home markets are counted separately, which is why a country such as Portugal appears as an origin without appearing in the ranking.
How does this study differ from your Doing Business in Europe ranking?
Doing Business in Europe ranks 29 countries on official economic and digital indicators: productivity, employment, investment, patents, cloud and AI adoption. This study ranks 14 markets on the behaviour of B2B sellers, measured by where they point their targeting. One tells you how strong a market is. The other tells you how crowded it already is. Denmark is second in that ranking and first here, which is the point: the strongest markets attract the most competition.