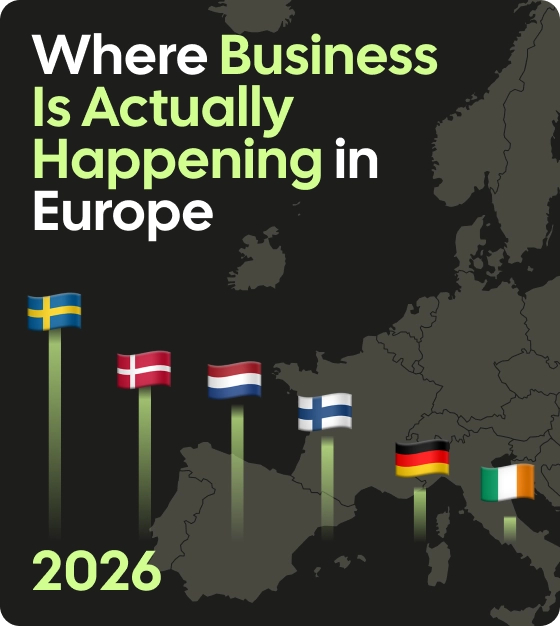
The table below ranks all 29 countries with complete data from highest to lowest Overall Score. Category ranks are included for Business Activity & Expansion, Investment, Innovation & Competitiveness, and Digitalisation (1 = best).
Scores are shown to one decimal place; gaps under 0.1 points count as ties (full list in the methodology).
A handful of records stand out from the table:
Denmark has the highest enterprise AI adoption rate in Europe at 42.0%, eight times Romania's 5.2%, which is the lowest in Europe.
Finland leads Europe on cloud computing at 79.2%, and Lithuania on e-commerce orders at 43.0%.
Of the 29 countries ranked, the Netherlands has the highest employment rate (83.4% of the working-age population) and Norway the highest labour productivity.
At the other end, Greece has the lowest investment rate of the 29 (16.9% of GDP), and Bulgaria the lowest labour productivity of the 29, as well as the lowest cloud adoption rate in Europe (17.8%).
Best for a balanced business environment and a knowledge-intensive workforce.
Top metrics:
Employment in Knowledge-Intensive Activities: 50.1%, rank 1
Employment Rate: 81.8%, rank 3
Artificial Intelligence Adoption: 35.0%, rank 3
Cloud Computing Adoption: 72.0%, rank 4
Enterprises Receiving Orders via E-commerce: 36.7%, rank 3
Sweden leads only one of the nine metrics outright, the share of employment in knowledge-intensive activities, where at 50.1% half the Swedish workforce is in higher-value work. What carries it to the top is consistency: top 6 finishes in all four categories, with Business Innovation & Competitiveness at 2nd, Business Digitalisation at 3rd, Business Activity & Expansion at 4th and Business Investment at 6th. No other country in the study manages that.
That consistency puts Sweden 5.6 points clear of second-placed Denmark, the widest gap between any two consecutive positions in the top nine.
Sweden's relative weak point is Business Investment, where a Gross Fixed Capital Formation rate of 24.9% ranks 6th. Even that is well ahead of larger economies like Germany (20.3%, rank 24) and France (22.2%, rank 15).
Best for access to Europe's most digitally advanced enterprise base.
Top metrics:
Artificial Intelligence Adoption: 42.0%, rank 1
Enterprises Receiving Orders via E-commerce: 38.8%, rank 2
Labour Productivity per Hour Worked: 107.5, rank 2
Cloud Computing Adoption: 68.9%, rank 5
Employment Rate: 79.8%, rank 10
Denmark's standout number is AI adoption: 42.0% of Danish enterprises report using artificial intelligence technologies, the highest rate in Europe. Romania is lowest at 5.2%, with Türkiye second-lowest at 7.4%, so Denmark's rate is eight times the European floor and more than double the European median of 18.0%. That strength carries through the entire Business Digitalisation category, where Denmark posts the best composite score of any country ranked.
Denmark also holds the second-highest labour productivity figure of the 29, trailing only Norway. What it lacks is investment: a Gross Fixed Capital Formation rate of 21.8% ranks joint 18th with Italy, meaning Denmark's second-place finish rests almost entirely on productivity and digital strength rather than capital formation.
Best for the labour market with the highest employment rate, plus solid digital adoption.
Top metrics:
Employment Rate: 83.4%, rank 1
Cloud Computing Adoption: 68.5%, rank 6
Artificial Intelligence Adoption: 33.2%, rank 5
Trademark Applications: 2,768.2 per million, rank 7
Gross Fixed Capital Formation: 20.1%, joint rank 25
The Netherlands has the highest employment rate of any country in the study: 83.4% of the population aged 20 to 64 is employed, ahead of Czechia (82.9%) and Sweden (81.8%). Combined with the second-best Business Activity & Expansion score in the ranking and solid digitalisation (rank 5), that's enough to put it third overall.
Its weak spot is investment. A Gross Fixed Capital Formation rate of just 20.1% ranks joint 25th with Bulgaria, putting the Netherlands' capital formation on par with countries far lower down the overall table.
Best for selling into the most cloud-mature enterprise base, backed by strong innovation output.
Top metrics:
Cloud Computing Adoption: 79.2%, rank 1
Artificial Intelligence Adoption: 37.8%, rank 2
Patent Applications: 740.4 per million, rank 2
Enterprises Receiving Orders via E-commerce: 34.3%, rank 5
Employment Rate: 76.3%, rank 19
Finland has the highest cloud computing adoption rate in Europe at 79.2%. Among the countries we ranked, Italy (75.6%) and Ireland (73.0%) follow. Finland also posts the second-highest patent application rate of the 29 (740.4 per million inhabitants, just behind Germany) and the second-highest AI adoption rate in Europe (37.8%).
That combination gives Finland the strongest Business Digitalisation score of any country except Denmark. Its weaker point is Business Activity & Expansion, where an employment rate below the study median (76.3%, rank 19) holds back an otherwise strong profile.
Best for access to the strongest innovation output, with digital adoption that lags the leaders.
Top metrics:
Patent Applications: 779.6 per million, rank 1
Trademark Applications: 3,339 per million, rank 5
Employment Rate: 81.1%, joint rank 6
Labour Productivity per Hour Worked: 96.5, rank 4
Artificial Intelligence Adoption: 26.0%, rank 8
Germany has the highest patent application rate of the 29 countries ranked: 779.6 per million inhabitants, more than double France's rate, though only narrowly ahead of Finland in second place (740.4). That gives it the best Business Innovation & Competitiveness score of any country in the study.
But Germany's digitalisation profile doesn't match its innovation output. An AI adoption rate of 26.0% ranks 8th and cloud adoption of 53.9% ranks 13th, giving it an overall Business Digitalisation score of 11th, behind Denmark, Finland, and smaller economies like Belgium, Lithuania and Ireland. Eleventh of 29 is not weak in absolute terms. It is weak for a country that leads the study on innovation, and it is the main reason the largest economy here sits 5th rather than higher.
The top five lead only five of the nine metrics; the other four belong to Norway, Lithuania and Türkiye. Every economy has a shape, and the profiles below show it for all 29 countries: what each is best for, what stands out, and where the four category ranks land. Pick any two and compare them head to head.
This section breaks the ranking down into its four categories, so you can see how each country earned its place. A single Overall Score hides a lot. Italy sits 16th overall, but its companies rank second in Europe for cloud adoption. Czechia misses the top ten even with the second-highest investment rate in the ranking. Each category section below explains what its metrics measure, shows who leads and who trails, and puts all 29 countries on one chart. If one category matters most to your business, start there.
This category combines labour productivity per hour worked with the employment rate for the population aged 20 to 64. It answers the simplest question you can ask of an economy: how much does an hour of work produce here, and how many people are working?
Norway leads it by a wide margin: its productivity figure of 123.0 is the highest of the 29, ahead of Denmark (107.5), Belgium (103.2), Germany (96.5) and Sweden (96.3). At the other end, Bulgaria records the lowest of the 29 at 21.7, less than a fifth of Norway's.
The employment metric produces a different top five. In the Netherlands, 83.4% of working-age people are employed, the highest share of any country ranked, followed by Czechia (82.9%), Sweden (81.8%), Estonia (81.7%) and Cyprus (81.3%). Germany and Hungary are joint 6th at 81.1%. Türkiye is lowest at 58.1%, with Bosnia and Herzegovina next at 59.5%. Finland is the notable gap in the leading group: strong on almost everything else, it ranks only 19th on employment at 76.3%, which is what keeps it 12th in this category despite being 4th overall.
Productivity and participation are not the same lever. Norway is the most productive place to work in the ranking and finishes 6th overall. Italy has one of the weakest labour markets here (23rd) and still lands 16th, carried by second place in Europe for cloud adoption and mid-table innovation.
Business Investment is measured through a single metric, gross fixed capital formation as a share of GDP. It carries the highest weight of any individual metric in the study (8 of 40), but because it is alone in its category, it contributes the smallest combined share of the four categories.
It is also the category that reorders the table most. Rank position here bears almost no relationship to rank position overall: the correlation between the two is 0.14, against 0.89 for digitalisation, for example.
Türkiye leads at 30.6% of GDP, followed by Czechia (26.4%), Bosnia and Herzegovina (25.8%), Croatia (25.7%) and Romania (25.6%). Greece is last at 16.9%, the lowest rate of the 29.
Every one of those five leaders finishes outside the overall top 10, and two of them (Romania 26th, Bosnia and Herzegovina 28th) finish in the bottom five of the whole ranking. Only Czechia, at 11th overall, finishes in the top half. The category's bottom five, meanwhile, includes the country that placed third overall.
Germany invests 20.3% of GDP (rank 24), the Netherlands 20.1% (joint rank 25) and Denmark 21.8% (joint rank 18). All three sit in the top five overall. A high investment rate often means a country is still building: new roads, factories, and networks. A low rate often means that building happened years ago, and the country now spends to maintain what it has. So this number shows where an economy is in its build-out, not how strong it is today.
This category combines patent applications per million inhabitants, trademark applications per million inhabitants, and the share of employment in knowledge-intensive activities. It contains the widest spread of any metric in the study: Germany files 779.6 patents per million inhabitants against Bosnia and Herzegovina's 10.7, a 73-fold gap. No other metric here comes close, with trademarks second at 11-fold.
Germany wins the category outright on that patent rate, more than double France's. Finland is a close second at 740.4 per million, then Sweden (641.9), Denmark (591.3) and the Netherlands (491.3). Germany also ranks 5th on trademarks at 3,339 per million, behind Türkiye (4,286.1), France (3,868.0), Cyprus (3,737.0) and Portugal (3,459.7).
Sweden takes second in the category on a different basis. It has the highest share of employment in knowledge-intensive activities of any country ranked, at 50.1%. Romania has the lowest share of the 29 at 24%. France takes third with the same invent-first, adopt-late profile as Germany: 3rd for innovation, 19th for digitalisation. Cyprus (8th) and Türkiye (9th) both outrank their overall positions here by a wide margin, in both cases on trademark applications rather than patents.
Worth noting: Switzerland files patents at 1,235 per million inhabitants and trademarks at 4,603 per million, both higher than any country in this ranking, and Luxembourg records 60.0% knowledge-intensive employment against Sweden's 50.1%. Both are excluded because they lack complete data across all nine metrics. See the methodology for the full list of exclusions.
This category combines three enterprise adoption measures: cloud computing, artificial intelligence, and the share of enterprises receiving orders via e-commerce. Along with business activity, it tracks the overall ranking most closely, and it is the only category where both the metric leaders and the metric floors hold across the whole of Europe rather than just the 29 countries ranked here. The runner-up positions below are scoped to the 29.
4.1. Cloud computing
Finland leads Europe at 79.2%. Of the 29 ranked, Italy (75.6%), Ireland (73.0%), Sweden (72.0%) and Denmark (68.9%) follow. Bulgaria is last in Europe at 17.8%. Italy placing second is the anomaly of this category: it finishes 16th overall and 23rd for business activity, yet its enterprises are more cloud-mature than Sweden's or Denmark's.
4.2. Artificial intelligence
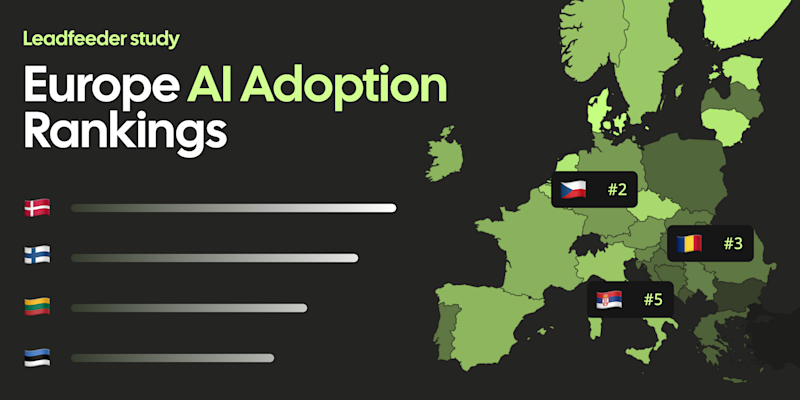
Denmark leads Europe at 42.0% of enterprises, then Finland (37.8%), Sweden (35.0%) and Belgium (34.5%). Of the 29 ranked, the Netherlands is 5th at 33.2%. Romania is last in Europe at 5.2%, with Türkiye second-lowest at 7.4%. The gap between top and bottom is eightfold, the widest spread of the three digitalisation metrics.
4.3. E-commerce orders
Lithuania leads Europe at 43.0%. Of the 29 ranked, Denmark (38.8%), Sweden (36.7%), Ireland (36.6%) and Finland (34.3%) follow. Türkiye is last in Europe at 13.5%. This metric is what lifts Lithuania to 6th for digitalisation, since its cloud (10th) and AI (11th) placings are solid rather than spectacular. It is also why Lithuania finishes 10th overall as the highest-ranked Baltic economy.
The Nordics take the top three places in this category, and the two largest economies in the ranking do not come close: Germany ranks 11th, behind Belgium and Lithuania, France ranks 19th, and Türkiye ranks 29th despite leading the ranking on investment. For AI adoption specifically, including which countries are improving fastest, see our Europe AI Adoption Rankings study.
Sweden, Denmark, the Netherlands, Finland and Norway fill five of the top 6 overall positions, with Germany the only outlier in that group. Each of them leads exactly one of the nine metrics, so none is dominant. What they share is where their weakness sits.
All five place in the top 8 for Business Digitalisation. For four of them, Sweden, Denmark, the Netherlands and Finland, the weakest category is Business Investment, which carries the smallest combined weight in the study at 8 of 40. Norway is the exception: its weak category is innovation, at 15th. And only Sweden has no category outside the top 6 at all. Give ground on investment and you can still win this ranking. Give ground on digitalisation, as Germany and France both do, and you cannot.
Norway posts the highest labour productivity figure of the 29 (123.0), and Denmark the second-highest (107.5). Sweden, which takes the overall top spot, ranks only 5th on this metric (96.3). Norway's overall position (6th) is held back by a mid-table innovation score (rank 15), while Sweden's advantage is that it has no comparable weak spot in any category.
Germany's patent rate (779.6 per million, rank 1) is the strongest in the ranking. Its Business Digitalisation score (rank 11) is not. France shows a similar pattern: a strong Business Innovation & Competitiveness score (rank 3) paired with a digitalisation rank of 19th out of 29. The two largest economies by GDP in this ranking are both being held back by the same category.
Türkiye posts the highest Gross Fixed Capital Formation rate of the 29 countries ranked (30.6% of GDP), giving it the best Business Investment score in the ranking. It still finishes 19th overall, dragged down by the weakest Business Digitalisation score in the study (rank 29). Bosnia and Herzegovina shows the same pattern on a smaller scale: 3rd for investment, 28th overall.
Romania's Gross Fixed Capital Formation rate (25.6%) ranks a respectable 5th, ahead of Germany, France, Italy and Spain, but it posts the lowest AI adoption rate in Europe (5.2%) and the lowest share of employment in knowledge-intensive activities of the 29 (24%), which pulls its overall position down to 26th.
The five lowest-placed countries overall are Serbia, Romania, Bulgaria, Bosnia and Herzegovina and Greece. What they have in common is not investment: Bosnia and Herzegovina ranks 3rd on it, Romania 5th and Serbia 14th. It is Business Activity & Expansion, where all five rank between 24th and 29th of 29, and four of them (Romania, Bulgaria, Serbia and Bosnia and Herzegovina) occupy four of that category's five bottom places.
The metric-level floors follow the same pattern. Bulgaria posts the lowest labour productivity figure of the 29 (21.7) and the lowest cloud computing adoption rate in Europe (17.8%). Bosnia and Herzegovina has the lowest patent rate of the 29 (10.7 per million) and the second-lowest employment rate (59.5%), behind Türkiye (58.1%). Greece is the exception: at 24th its activity rank is the strongest of this group, and it finishes last overall on the lowest investment rate of the 29 instead.
We put four questions from this study to five members of the Leadfeeder leadership team, who run a European B2B business day to day.
Frequently Asked Questions
Which European country has the strongest overall business environment?
Sweden has the strongest overall business environment of the 29 European countries in this study, with a score of 74.8. It leads just one of the nine metrics, the share of employment in knowledge-intensive activities, but it is the only country to finish in the top 6 of all four categories.
Which European country has the highest labour productivity?
Norway has the highest labour productivity figure of the 29 countries ranked (123.0), ahead of Denmark (107.5) and Belgium (103.2). Despite this, Norway ranks only 6th overall because its innovation and investment scores sit closer to the middle of the table. Luxembourg (128.96) and Switzerland (108.60) both record higher productivity but were excluded from the ranking for missing data on other metrics.
Which European country has the highest AI adoption among enterprises?
Denmark has the highest enterprise AI adoption rate in Europe, at 42.0%. Finland is second at 37.8% and Sweden third at 35.0%. Romania is lowest in Europe at 5.2%, with Türkiye second-lowest at 7.4%, making Denmark's rate eight times the floor and more than double the European median of 18.0%.
Which European country has the highest cloud computing adoption?
Finland leads Europe on cloud computing adoption, with 79.2% of enterprises using cloud services. Among the 29 countries we ranked, Italy (75.6%), Ireland (73.0%), Sweden (72.0%) and Denmark (68.9%) follow. Malta, which was excluded from the ranking for missing data on other metrics, sits between Italy and Ireland at 75.1%. Bulgaria has the lowest rate in Europe at 17.8%.
Which European country has the highest employment rate?
The Netherlands has the highest employment rate of the 29 countries ranked, with 83.4% of the population aged 20 to 64 employed, ahead of Czechia (82.9%) and Sweden (81.8%). Iceland (85.8%), Malta (83.6%) and Switzerland (82.4%) all record higher rates than at least one of those three but were excluded from the ranking for missing data on other metrics.
Why does Germany rank lower than its economic size would suggest?
Germany posts the best innovation score in the study, driven by the highest patent application rate of any country ranked (779.6 per million inhabitants). But its Business Digitalisation score ranks just 11th: AI adoption of 26.0% ranks 8th and cloud adoption of 53.9% ranks 13th, leaving Germany behind smaller economies like Belgium, Lithuania and Ireland on the digitalisation category overall. That gap between innovation and digital adoption is the main reason Germany finishes 5th rather than higher.
Which countries invest the most relative to the size of their economy?
Türkiye has the highest Gross Fixed Capital Formation rate of the 29 countries ranked (30.6% of GDP), followed by Czechia (26.4%), Bosnia and Herzegovina (25.8%) and Croatia (25.7%). Only Czechia, at 11th, finishes in the top half of the overall ranking, because strong investment alone doesn't compensate for weak digitalisation and innovation scores. Kosovo records a higher rate still (32.4%) but was excluded from the ranking, as only one of the nine metrics was available for it.
Which European country is the most innovative?
Germany has the strongest Business Innovation & Competitiveness score in the study, driven by the highest patent application rate per capita of any country ranked. Sweden is second, on the strength of the highest share of employment in knowledge-intensive activities of any country ranked (50.1%). France is third. Two excluded countries would have featured here: Switzerland files more patents and trademarks per capita than any ranked country, and Luxembourg records 60.0% knowledge-intensive employment against Sweden's 50.1%.
Why does this study rank digital adoption differently from your AI adoption study?
Both studies use the same Eurostat figures, so the underlying numbers match: Denmark 42.0%, Finland 37.8%, Germany 26.0%. The composite rankings differ because they measure different things. This study scores three current-level metrics (cloud, AI, e-commerce) across 29 countries. Our Europe AI Adoption Rankings 2026 study scores 13 metrics across 32 countries, including growth rates, which rewards the countries improving fastest. That is why Lithuania places 3rd there against 6th here for digitalisation, and Estonia 4th there against 10th here.
This study covers 29 European countries with complete data across all nine metrics used in the ranking: Belgium, Bulgaria, Czechia, Denmark, Germany, Estonia, Ireland, Greece, Spain, France, Croatia, Italy, Cyprus, Latvia, Lithuania, Hungary, Netherlands, Austria, Poland, Portugal, Romania, Slovenia, Slovakia, Finland, Sweden, Norway, Bosnia and Herzegovina, Serbia, and Türkiye.
A further 11 countries in the wider dataset (Luxembourg, Malta, Iceland, Liechtenstein, Switzerland, Montenegro, Moldova, North Macedonia, Albania, Ukraine, and Kosovo) were excluded from the full ranking due to missing data across one or more metrics.
Labour productivity data comes from The Conference Board. Employment rate, gross fixed capital formation, employment in knowledge-intensive activities, cloud computing adoption, AI adoption, and e-commerce order data come from Eurostat. Patent and trademark application data comes from the World Intellectual Property Organization (WIPO).
Gross Fixed Capital Formation carries the single highest weight of any individual metric (8), but because Business Investment is the only metric in its category, it contributes the least combined weight of the four categories overall (8 of 40, against 12 for activity and 10 each for innovation and digitalisation). That's part of why a country can lead this ranking on investment and still finish well outside the top 10.
Each metric was normalised to a 0 to 100 scale using min-max normalisation, with larger values treated as better across all nine metrics. Normalised scores were multiplied by their assigned weight and summed within each category, then combined into a single Overall Score for each country.
Where the study quotes a raw figure, such as Norway's labour productivity of 123.0 or Denmark's AI adoption of 42.0%, that is the source value. Normalised 0 to 100 scores are used only for category and overall scores.
Overall Scores are reported to one decimal place. Given nine weighted metrics and min-max normalisation, differences smaller than 0.1 points should not be read as meaningful separations. Two pairs fall inside that margin: Croatia and Türkiye (18th and 19th, separated by 0.011 points) and Bosnia and Herzegovina and Greece (28th and 29th, separated by 0.004 points). Both pairs are best understood as tied.
Six exact ties also arise at metric level, across three of the nine metrics. On employment rate, Germany and Hungary are joint 6th (both 81.1%). On gross fixed capital formation, Finland and Hungary are joint 16th (21.9%), Denmark and Italy joint 18th (21.8%), and the Netherlands and Bulgaria joint 25th (20.1%). On knowledge-intensive employment, Hungary and Slovenia are joint 14th (36.5%) and Czechia and Croatia joint 18th (35.7%). The other six metrics produce 29 distinct values each.
One metric and country combination among the 29 ranked had missing data: Ireland's Trademark Applications figure was not available. In this case, the metric was excluded from Ireland's Business Innovation & Competitiveness score and from its Overall Score, which may result in a marginal over- or under-estimation of its position.
This study is free to cite, quote and reproduce with attribution. Journalists, analysts and researchers are welcome to use the tables and figures.
Suggested citation: Leadfeeder (2026), Doing Business in Europe: Where the Action Is in 2026. Available at https://www.leadfeeder.com/resources/studies/doing-business-in-europe/.
Download the dataset: the full scoring table for all 29 ranked countries across all nine metrics, plus the raw figures for the 11 excluded countries, is available as a Google Sheet.
For methodology questions or media enquiries, contact serban.giurgi@leadfeeder.com.
If these are the markets you're expanding into or selling to, the next question is which companies in them are already engaging with you. That's what Leadfeeder does: B2B website visitor identification turns anonymous traffic into the named companies showing intent, connecting country-level signals like these to the specific accounts on your website. Leadfeeder will continue tracking the European business environment. Bookmark this page for updated rankings as new data is released, and follow our research programme for deeper dives into individual categories and country profiles.